Find what’s breaking your growth. Fix it fast with real UX experiments.
CrackGrowth shows you where users drop off, and gives you 3 to 9 ready-to-run experiments to fix it. Perfect for solo builders, SaaS teams, and growth PMs who need clarity, fast.
Find what’s breaking your growth. Fix it fast with real UX experiments.
CrackGrowth shows you where users drop off, and gives you 3 to 9 ready-to-run experiments to fix it. Perfect for solo builders, SaaS teams, and growth PMs who need clarity, fast.
Find what’s breaking your growth. Fix it fast with real UX experiments.
CrackGrowth shows you where users drop off, and gives you 3 to 9 ready-to-run experiments to fix it. Perfect for solo builders, SaaS teams, and growth PMs who need clarity, fast.
Get the edge of companies with million-dollar teams
You don’t need a giant growth team to build like one. CrackGrowth helps you find UX issues, test real experiments, and scale smarter, just like the companies you look up to.
Get the edge of companies with million-dollar teams
You don’t need a giant growth team to build like one. CrackGrowth helps you find UX issues, test real experiments, and scale smarter, just like the companies you look up to.
Get the edge of companies with million-dollar teams
You don’t need a giant growth team to build like one. CrackGrowth helps you find UX issues, test real experiments, and scale smarter, just like the companies you look up to.
Your UX is leaking users.
Get 9 targeted fixes in under 1 minute.
Your UX is leaking users.
Get 9 targeted fixes in under 1 minute.
Your UX is leaking users.
Get 9 targeted fixes in under 1 minute.
You can’t fix what you can’t see
You can’t fix what you can’t see
You can’t fix what you can’t see
See exactly where your product drops the ball.
Traffic’s coming in. Users are signing up. But then… nothing. CrackGrowth pinpoints the exact moment your product drops the ball, whether it’s clunky onboarding, pricing confusion, or a missing “aha.”
Problem statement
Problem statement
Problem statement
I don't know why my users are churning
" width="15.058823529411764px"><path d="M 0 15.059 L 0 0 L 15.059 0 L 15.059 15.059 Z" fill="transparent" height="15.058823529411764px" id="gvmOqIvhj" transform="translate(0 0)" width="15.058823529411764px"/><path d="M 5.145 2.698 L 2.698 5.145 M 3.137 6.275 C 3.137 7.141 2.435 7.843 1.569 7.843 C 0.702 7.843 0 7.141 0 6.275 C 0 5.408 0.702 4.706 1.569 4.706 C 2.435 4.706 3.137 5.408 3.137 6.275 Z M 3.137 6.275 L 9.412 6.275 M 9.412 6.275 C 9.412 7.141 10.114 7.843 10.98 7.843 C 11.847 7.843 12.549 7.141 12.549 6.275 C 12.549 5.408 11.847 4.706 10.98 4.706 C 10.114 4.706 9.412 5.408 9.412 6.275 Z M 7.404 9.851 L 9.851 7.404 M 7.843 1.569 C 7.843 2.435 7.141 3.137 6.275 3.137 C 5.408 3.137 4.706 2.435 4.706 1.569 C 4.706 0.702 5.408 0 6.275 0 C 7.141 0 7.843 0.702 7.843 1.569 Z M 7.843 10.98 C 7.843 11.847 7.141 12.549 6.275 12.549 C 5.408 12.549 4.706 11.847 4.706 10.98 C 4.706 10.114 5.408 9.412 6.275 9.412 C 7.141 9.412 7.843 10.114 7.843 10.98 Z" fill="transparent" height="12.549025955392334px" id="nfyxHiSIE" stroke-dasharray="" stroke-linecap="round" stroke-linejoin="round" stroke-width="1.25" stroke="rgb(30, 64, 175)" transform="translate(1.255 1.254)" width="12.548979381813028px"/></g></svg>)
1 Analytics file
" width="15.058823529411764px"><path d="M 0 15.059 L 0 0 L 15.059 0 L 15.059 15.059 Z" fill="transparent" height="15.058823529411764px" id="g2tAbi4RU" transform="translate(0 0)" width="15.058823529411764px"/><path d="M 10.039 12.549 L 1.255 12.549 C 0.922 12.549 0.603 12.417 0.368 12.181 C 0.132 11.946 0 11.627 0 11.294 L 0 2.51 M 12.549 6.902 L 11.736 6.089 C 11.452 5.805 11.068 5.646 10.667 5.646 C 10.266 5.646 9.881 5.805 9.597 6.089 L 5.647 10.039 M 7.529 3.765 C 7.529 4.458 6.968 5.02 6.275 5.02 C 5.581 5.02 5.02 4.458 5.02 3.765 C 5.02 3.072 5.581 2.51 6.275 2.51 C 6.968 2.51 7.529 3.072 7.529 3.765 Z M 3.765 0 L 11.294 0 C 11.987 0 12.549 0.562 12.549 1.255 L 12.549 8.784 C 12.549 9.477 11.987 10.039 11.294 10.039 L 3.765 10.039 C 3.072 10.039 2.51 9.477 2.51 8.784 L 2.51 1.255 C 2.51 0.562 3.072 0 3.765 0 Z" fill="transparent" height="12.549026067472624px" id="wpSohfSvv" stroke-dasharray="" stroke-linecap="round" stroke-linejoin="round" stroke-width="1.25" stroke="rgb(91, 33, 182)" transform="translate(1.255 1.254)" width="12.548978801714249px"/></g></svg>)
4 App screenshots
Diagnosis summary
Label
Most users churn after hitting the feature tour screen.
Drop-off is 48% higher than average
Recommended experiments
Recommended experiments
Recommended experiments
Break feature tour into swipeable cards
Shorter interactions reduce abandonment on mobile apps.
Ideas don’t grow your product—execution does
Ideas don’t grow your product—execution does
Ideas don’t grow your product—execution does
Track what you test. Learn what works.
Shipping is easy. Learning is hard. That’s why CrackGrowth gives every experiment its own space, with clear status, effort tags, and a reflection prompt, so you grow faster, not just ship faster.
Four stage board
In queue
12
Running
1
Successful
8
Failed
3
Built-in reflection prompts
AI Assistant
Did this experiment improve the target metric you were tracking?
Yes, for sure!
AI Assistant
What do you think made this experiment successful?
User is typing…
Effort tiers
Low effort
Low effort
Low effort
Implement progress indicators
Mid effort
Mid effort
Mid effort
Streamline onboarding content
High effort
High effort
High effort
Redesign onboarding UI & flow
For when you don’t know what to try next
For when you don’t know what to try next
For when you don’t know what to try next
Never run out of growth ideas again.
coming soon
coming soon
coming soon
Stop guessing. Start testing. CrackGrowth’s library gives you 200+ proven experiments, real UX patterns used to lift signups, reduce bounce, and drive upgrades.
200+ Curated templates
From checkout optimizations to onboarding nudges, each one tied to a growth metric.
Filter & favorite
Find ideas fast with tags like “Activation uplift” or “Mobile onboarding".
One-click to board
Instantly drop any experiment into your kanban tracker, no copy-paste needed.
Fix what’s broken, in just 7 days.
Run a focused sprint to find what’s breaking your UX, test real experiments, and see what actually moves the needle.
Today
Diagnose & prioritize
Find your top blocker
Pick 3 fast, high-impact experiments
Prioritize what drives results
Day 3
Review & iterate
Check your metrics for movement
Spot patterns in user behavior
Double down on what worked
Day 7
Launch & manage
Launch your first experiment
Track what shipped, what’s in queue
Stay focused using the tracker
Test before you commit. Upgrade when you’re ready.
Monthly billing
Yearly billing
(Save 17%)
Free
Test before commitment
$0
/month
1 diagnostic
Up to 9 suggested experiments
Tracker access
Experiment library
No credit card required
Best for early-stage testing
Pro
Billed yearly
$25
/month
Unlimited diagnostics
Unlimited experiments
AI assistant for insight & guidance
Tracker access
Experiment library
Best for anyone ready to grow faster
Quick answers to your questions.
What does a CrackGrowth diagnostic actually do?
A diagnostic analyzes your UX or growth issue and gives you a structured breakdown: what’s broken, which metrics are affected, and 3–9 experiments you can try to fix it.
What does a diagnostic report look like?
You’ll get a clean summary with the problem, impacted metrics, relevant UX principles, and experiment suggestions, categorized by effort (low/mid/high). It’s like having a growth strategist write a playbook just for you.
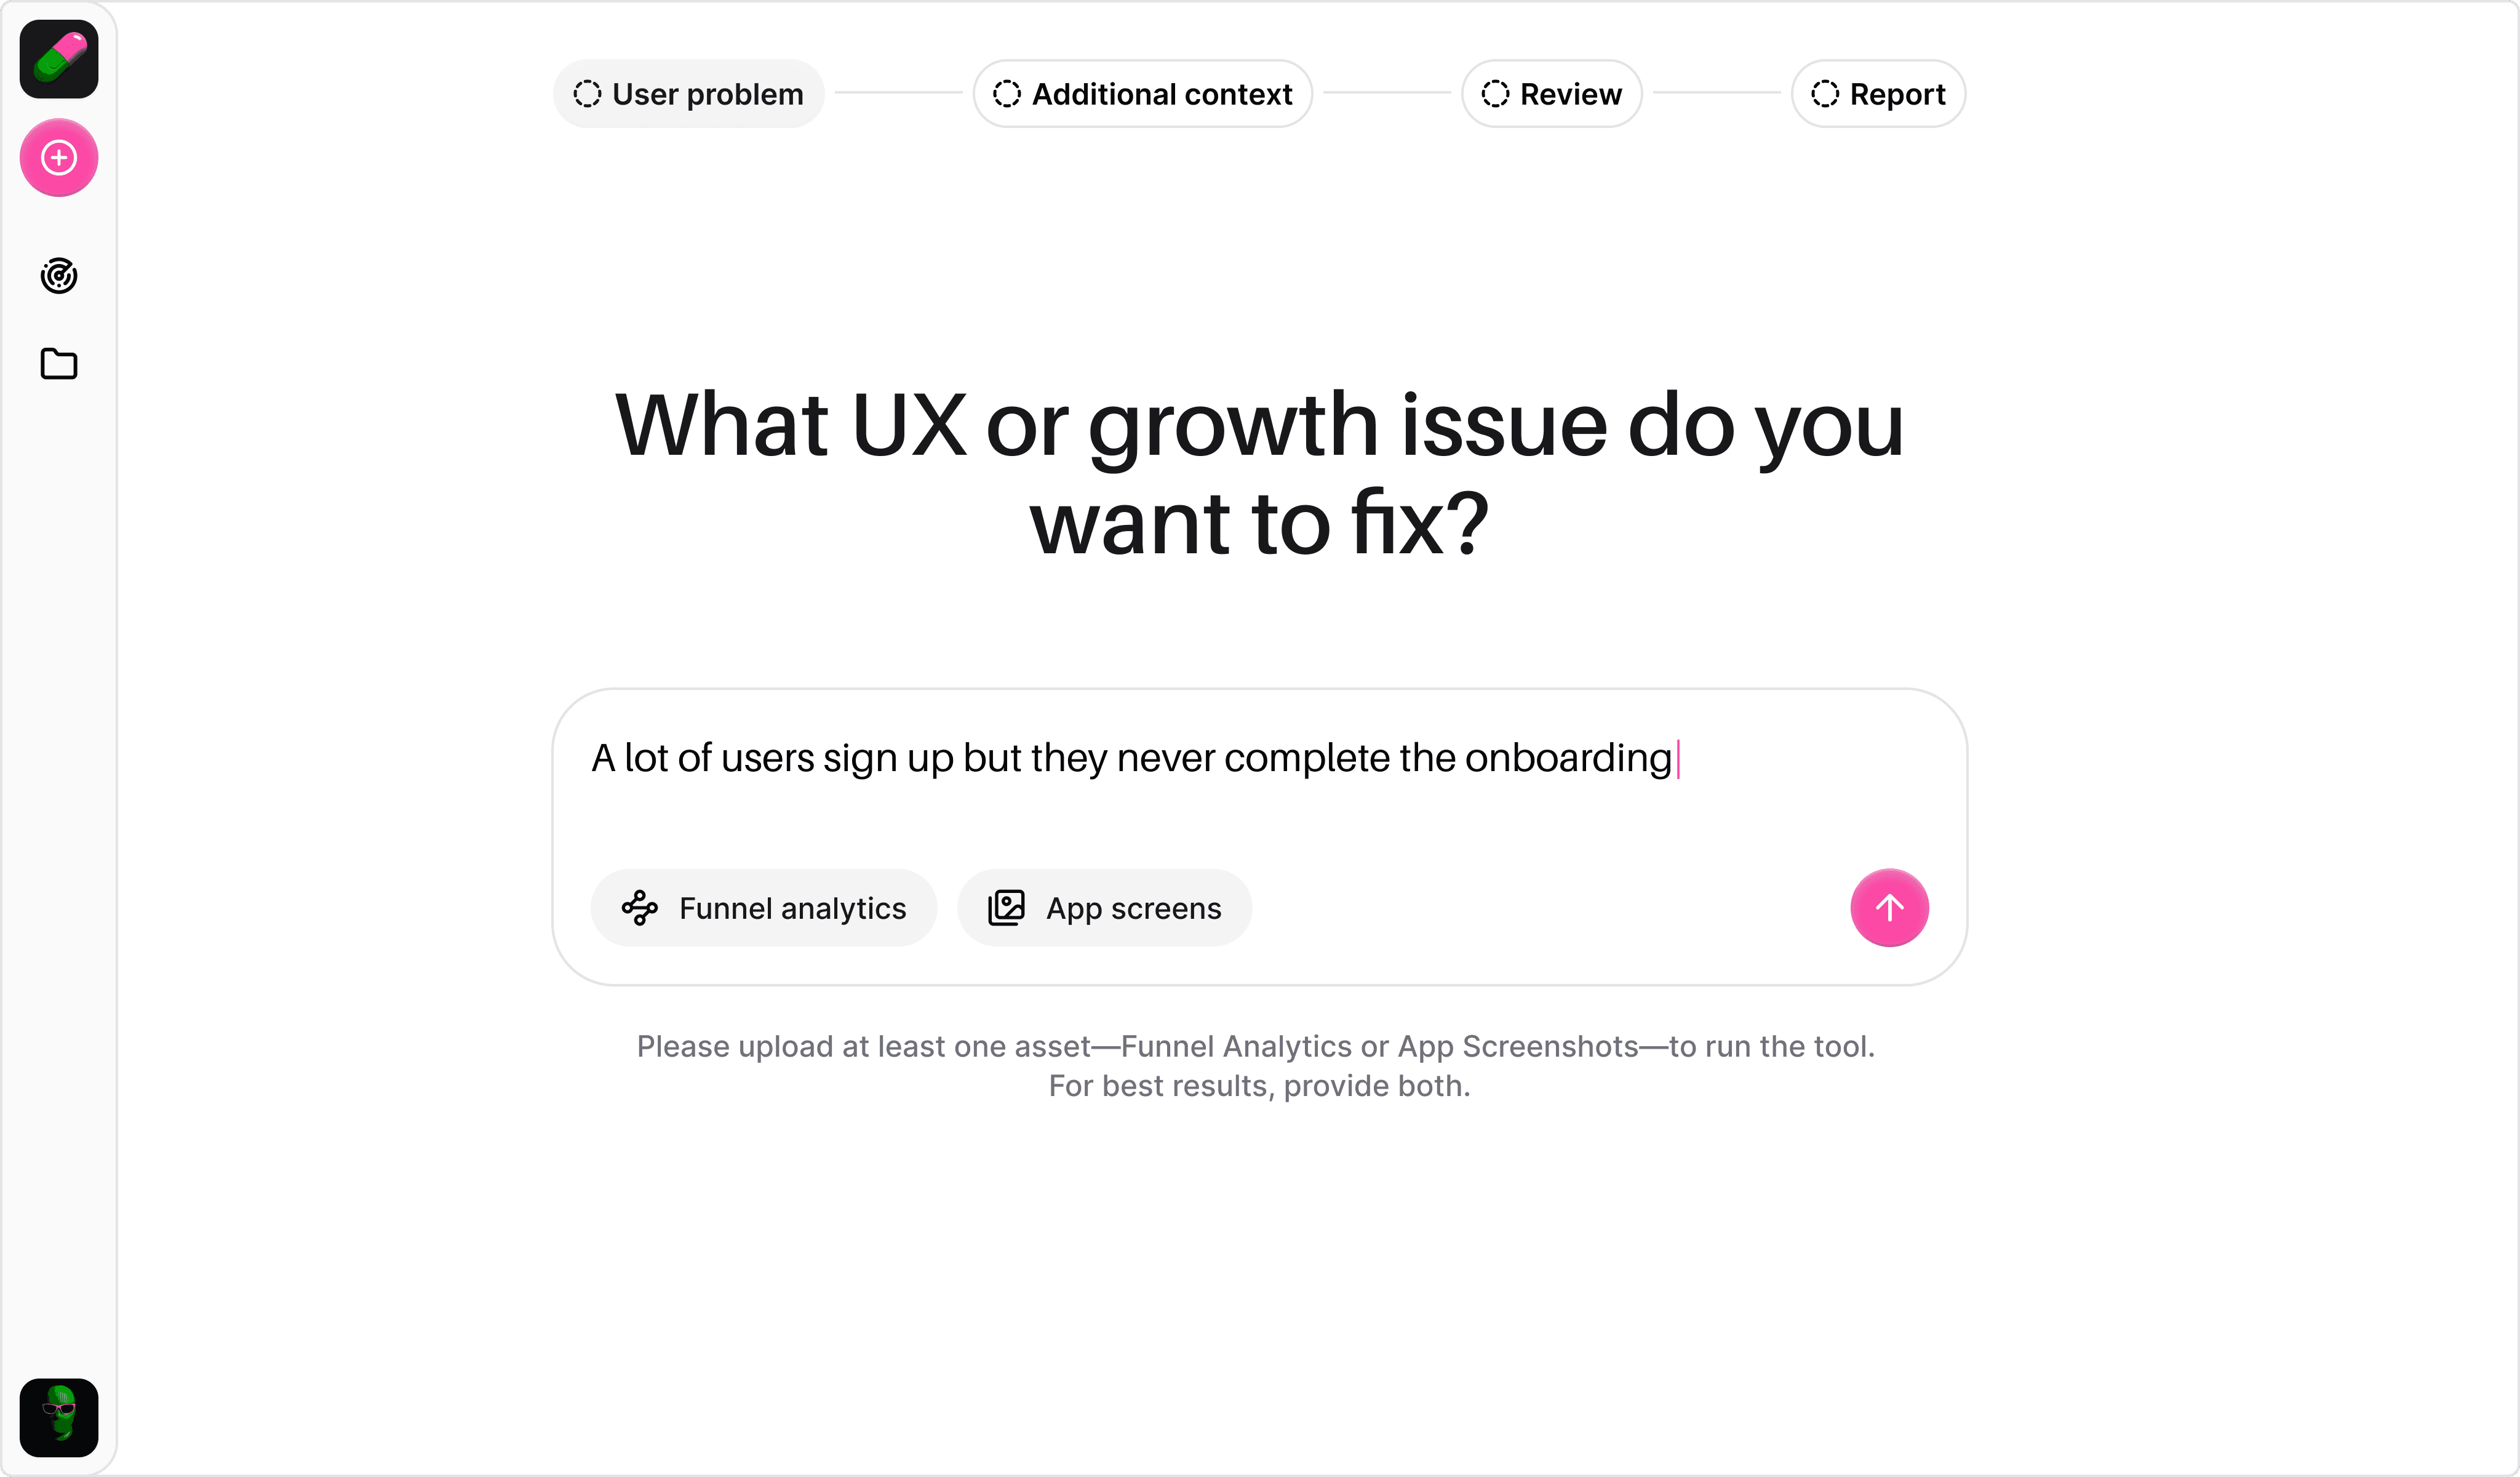
Do I need to upload data?
Nope. You can describe your issue in plain English. But if you upload funnel metrics or screenshots, you’ll get more targeted results.
What kind of experiments will I get?
You’ll get tested, actionable UX ideas, like onboarding tweaks, plan nudges, or pricing page copy changes, tailored to your issue.
Is this just for UX? Or does it help with growth too?
CrackGrowth is built for both. The tool ties UX issues to growth outcomes, activation, retention, upgrades. and gives you experiments that directly affect those numbers.
Does this replace tools like Mixpanel / PostHog / GA?
No. CrackGrowth isn’t an analytics tool, it’s what comes after your analytics show a problem. You bring the signals. We help you fix them.
Still have questions?
Hit us up! we’re real humans, and we’ll reply fast.
Quick answers to your questions.
What does a CrackGrowth diagnostic actually do?
A diagnostic analyzes your UX or growth issue and gives you a structured breakdown: what’s broken, which metrics are affected, and 3–9 experiments you can try to fix it.
What does a diagnostic report look like?
You’ll get a clean summary with the problem, impacted metrics, relevant UX principles, and experiment suggestions, categorized by effort (low/mid/high). It’s like having a growth strategist write a playbook just for you.
Do I need to upload data?
Nope. You can describe your issue in plain English. But if you upload funnel metrics or screenshots, you’ll get more targeted results.
What kind of experiments will I get?
You’ll get tested, actionable UX ideas, like onboarding tweaks, plan nudges, or pricing page copy changes, tailored to your issue.
Is this just for UX? Or does it help with growth too?
CrackGrowth is built for both. The tool ties UX issues to growth outcomes, activation, retention, upgrades. and gives you experiments that directly affect those numbers.
Does this replace tools like Mixpanel / PostHog / GA?
No. CrackGrowth isn’t an analytics tool, it’s what comes after your analytics show a problem. You bring the signals. We help you fix them.
Still have questions?
Hit us up! we’re real humans, we’ll reply fast.

Ready to fix what’s breaking your growth?
Free diagnostic. 9 growth experiments. 60 seconds. No setup. No excuses.
Ready to fix what’s breaking your growth?
Free diagnostic. 9 growth experiments. 60 seconds. No setup. No excuses.
Ready to fix what’s breaking your growth?
Free diagnostic. 9 growth experiments. 60 seconds. No setup. No excuses.